-
Economic Perspectives
Trade with China:
Part 2 of 2
July 2024
- Filename
- Economic Perspectives JULY 2024.pdf
- Format
- application/pdf

TRANSCRIPT
Welcome to the second installment on our topic of trade with China. This time, we’ll focus on tariffs. If you missed part one, be sure to check it out. →
Tariffs are taxes that apply to imports. They’re used by governments to protect domestic industries, address trade imbalances, retaliate against unfair trade practices, and collect tax revenue. Historically, tariffs were major sources of revenue for the federal government, from the country’s beginning, until 1913, when the 16th amendment was ratified, and the federal government was granted the right to impose a federal income tax. The constitution grants Congress the ability to impose tariffs, but, since the 1930’s, Congress has delegated more of that trade authority to the president.
Since the end of World War II, tariffs have fallen to the sidelines as free trade has become “modus operandi.” That’s because the economic benefits have shifted toward efficiencies of free trade and less government interference for businesses and consumers.
Economists don't tend to favor tariffs, for many reasons. Primarily, tax policy changes should aim to boost growth and competitiveness. Tariffs don't tend to do that.
A tariff is a tax that increases the price of the item, which is inflationary, and the consumer is usually the one who has to pay that tax, which is a regressive impact because, disproportionately, it’s going to impact those at the lower end of the income spectrum. The tax is hidden. The consumer does not know how much of the higher price is due to the tariff, and how much of it is due to the retailer using the tariff as an excuse to increase the profit margin on its sale. Tariffs can make domestic producers less efficient and innovative by reducing the competition. Finally, tariffs can cause retaliation by hurting exporters, and it can quickly turn into a trade war.
Now, the other side of the coin is taking center stage; foreign producers had been accused of using unfair trade practices to help lower the prices of their items. Imports of lower-priced goods in the 1990’s and early 2000’s exploded with growth, widening the trade deficit. The cheaper imports helped reduce inflationary pressures from the 3% range to 1%, but, at the same time, made it difficult for domestic manufacturers to compete on price, and they had to reduce or cease operations, laying off many workers.
It’s becoming clearer that, although free trade benefits consumers with lower costs, and some businesses with higher profit margins due to lower production costs, it has hurt many American workers, mostly in the manufacturing sector. Manufacturing represents about 11% of GDP. More importantly, it is one of the highest multiplying effects of any sector in the economy.
Each dollar spent on manufacturing triggers a chain reaction of increased material purchases, job creation, and further economic expansion. This is why tariffs have become major political tools. Most importantly, this is a critical political issue in the Midwestern industrial states, which are the same states that will likely decide the upcoming presidential election.
Both presidents Donald Trump and Joe Biden have used tariffs as a method of supporting domestic industries amid an economic confrontation with China. It started in 2018, when the Trump administration imposed tariffs by executive order because the imports of washers, solar cells, and modules were considered to have serious negative impacts on domestic manufacturers. Generally speaking, the Biden administration preserved the Trump administration’s tariffs on steel, aluminum, and the majority of goods from China. They increased some tariffs on green technology and reduced or eliminated many of the newly enacted tariffs on our close allies.
Let's take a look at some of the charts to get a better understanding.
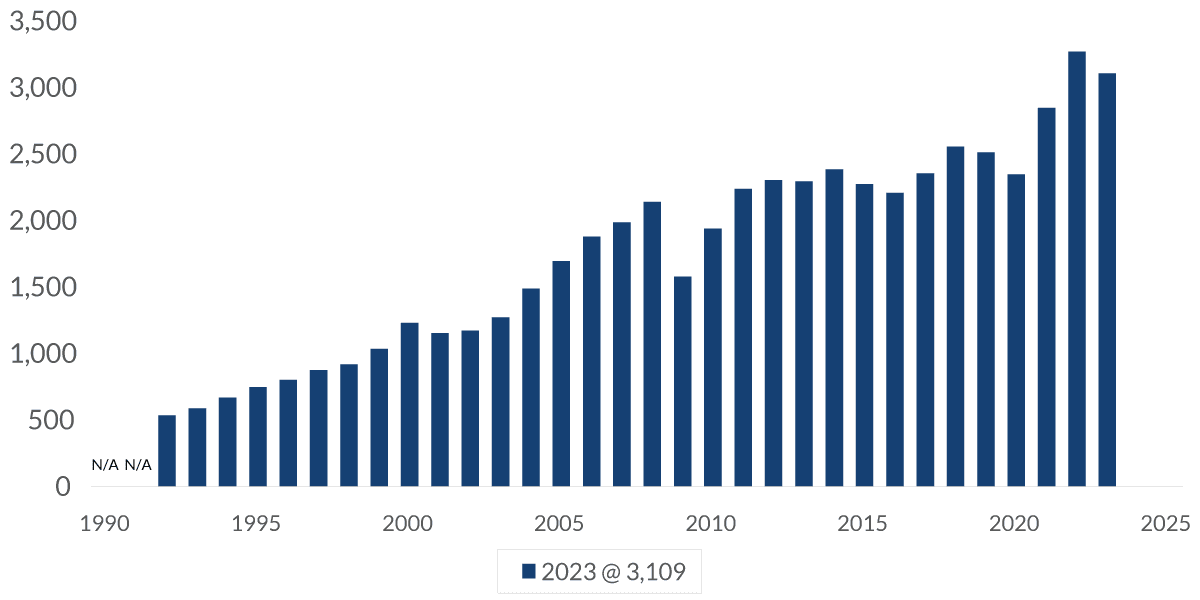
Chart 1: Trade Balance: Import of Goods
$, millions, annual amount
Data current as of July 24, 2024
Sources: U.S. Census Bureau
Information is subject to change and is not a guarantee of future results.
Chart 1, 4:33– This chart shows the amount of goods imported each calendar year. You can see how, in the early 1990’s, the United States imported about a half-billion dollars’ worth of goods each year. Last year, it was more than three trillion dollars – that's about a sixfold increase.
The most impressive gain was from 2000 to 2010, right after China joined the World Trade Organization (in 2001). With all those imported goods, the demand for domestic goods fell, helping to cause a decline in manufacturing employment.
Chart 2: Manufacturing Employment
millions, seasonally adjusted

Data current as of July 24, 2024
Source: Bureau of Labor Statistics
Information is subject to change and is not a guarantee of future results.
Chart 2, 5:09– This chart shows the number of U.S. workers in the field of manufacturing. It peaked at almost $20 million in the late 1970’s and has since declined to about $13 million. The sharpest decline was in the decade from 2000 to 2010, with a loss of 5.7 million jobs – that’s a drop of about one-third. This was devastating to many households and communities.
Chart 3: Receipts of Customs Duties
$, billions, %, 12-month rolling sum
Data current as of July 24, 2024
Source: U.S. Treasury
Information is subject to change and is not a guarantee of future results.
Chart 3, 5:35– Because of that devastation, tariffs became new tools in combating issues of trade. This chart shows the tariff revenue coming into the United States Treasury. It’s about $75 billion dollars for the past 12 months. That's more than double the amount it was before the first tariff was put into place by the Trump administration in January 2018. It’s a very large tax increase; although it sounds like a big number for the federal government, it’s not.
The receipts from income taxes are 32 times bigger, for example. Tariffs do not provide a meaningful share of revenue to the country, and they can’t. But you can see in the light-blue shaded area, they account for less than 2% of the receipts coming into the federal government.
Chart 4: U.S. Average Tariff Rate on China Exports
%, average tariff rate
Data current as of July 24, 2024
Source: Peterson Institute for International Economics
Information is subject to change and is not a guarantee of future results.
Chart 4, 6:26– In this chart, you can see the ramping up of the tariffs during the Trump administration, and that the Biden administration pretty much maintained those same levels. To put this in perspective, this chart shows in the light-blue line what China’s tariff is on imports from the United States. The shaded area at the bottom is the net difference between the two, and you can see, on average, that their tariffs are about two-and-a-half percentage points higher than the United States.
Chart 5: Import of Goods from China
$, billions, not seasonally adjusted

Data current as of July 24, 2024
Source: U.S. Census Bureau
Information is subject to change and is not a guarantee of future results.
Chart 5, 6:58– This chart shows that tariffs are having an impact. It shows the amount of goods imported from China since 2010. There’s a light-blue vertical line when the first Trump administration’s tariff was put into place. There’s a dotted trend line of the period from 2010 to 2017, shortly before the tariffs went into place. Since then, the number of goods being imported has started to decline. They did recover following the recession, but that was due to the surging demand of goods when we were at the stay-at-home period.
As of today, imports have declined by $9.5 billion dollars, and are down 21% from December 2017, the month before the first tariff was put into place.
Chart 6: Import of Goods: By Partner
$, billion, 12-month rolling sum, not seasonally adjusted
Data current as of July 24, 2024
Source: U.S. Census Bureau
Information is subject to change and is not a guarantee of future results.
Chart 6, 7:50– This chart shows the goods imported from many of our major trading partners. It is a rolling sum of the past 12 months, and this helps move out the data for easy comparison. The largest source comes from the European Union in the blue-gray line. It has been the largest source of imports since December 2022, when they surpassed China. It is followed by the Pacific Rim, which excludes China, Mexico, and then Canada. China, in the thick black line, peaked in September 2022, and it has been declining ever since.
China now accounts for 13.2% of all goods imported into the United States. That’s below the 15.8% level it was before the tariff started. Looking forward, Trump’s approach to tariffs is considered a very broad protectionist plan. He is promising to ratchet up his trade war to a higher degree. He calls for a 10% universal tariff, very high tariffs on Chinese imports, and extremely large tariffs on electric vehicles. There has also been talk of higher levies on certain countries that devalue their currency.
As for the Harris platform, we don't know much about it yet, but we will assume that it will generally follow the same path that the Biden administration had, which was a more tactical approach to rebuilding domestic manufacturing and investing in a green transition.
The bottom line is this: When adding a new tax, there are some that will benefit, and some that will get hurt. For example, a tariff on steel imports may help out the steel industry, but any manufacturer that uses steel now has a higher input cost. There’s also the risk of a retaliatory tariff that may hurt a domestic exporter. Global trade is complicated. What we need is a comprehensive trade policy.
Important Information
The information presented does not involve the rendering of personalized investment, financial, legal, or tax advice. This presentation is not an offer to buy or sell, or a solicitation of any offer to buy or sell any of the securities mentioned herein.
Certain statements contained herein may constitute projections, forecasts and other forward-looking statements, which do not reflect actual results and are based primarily upon a hypothetical set of assumptions applied to certain historical financial information. Viewers are cautioned that such forward-looking statements are not a guarantee of future results, involve risks and uncertainties, and actual results may differ materially from those statements. Certain information has been provided by third-party sources and, although believed to be reliable, it has not been independently verified and its accuracy or completeness cannot be guaranteed.
Any opinions, projections, forecasts, and forward-looking statements presented herein are valid as of the date of this video’s distribution and are subject to change.
Past performance or performance based upon assumptions is no guarantee of future results.
All investing is subject to risk, including the possible loss of the money you invest. As with any investment strategy, there is no guarantee that investment objectives will be met and investors may lose money. Diversification does not ensure a profit or protect against a loss in a declining market.
City National Rochdale, LLC is an SEC-registered investment adviser and wholly-owned subsidiary of City National Bank. Registration as an investment adviser does not imply any level of skill or expertise. City National Bank is a subsidiary of the Royal Bank of Canada. City National Bank provides investment management services through its subadvisory relationship with City National Rochdale. Brokerage services are provided through City National Securities, Inc., a wholly-owned subsidiary of City National Bank and Member FINRA/SIPC.
Index Definitions
Chinese money is referred to by two names: the Chinese yuan (CNY) and renminbi (RMB), which translates to "People's Currency." The distinction between CNY and RMB is subtle. RMB is the official currency of China. The yuan is the principal unit of account for that currency.
The World Trade Organization (WTO) is the only global international organization dealing with the rules of trade between nations. At its heart are the WTO agreements, negotiated and signed by the bulk of the world’s trading nations and ratified in their parliaments. The goal is to help producers of goods and services, exporters, and importers conduct their business.
© 2024 City National Bank. All rights reserved.
CITY NATIONAL ROCHDALE, LLC NON-DEPOSIT INVESTMENT PRODUCTS ARE: • NOT FDIC INSURED •NOT BANK GUARANTEED •MAY LOSE VALUE
Stay Informed.
Get our Insights delivered straight to your inbox.


Put our insights to work for you.
If you have a client with more than $1 million in investable assets and want to find out about the benefits of our intelligently personalized portfolio management, speak with an investment consultant near you today.
If you’re a high-net-worth client who's interested in adding an experienced investment manager to your financial team, learn more about working with us here.