Market Perspectives: A “Tariff-ying” Start to the 2nd Quarter
Although the recent jobs report showed a robust gain of 272,000, there has been significant moderation ever since the Federal Reserve (Fed) began raising interest rates in March 2022.
This slowing in the pace of hiring is in line with the Fed’s goal of achieving a sustainable level of growth. Data in the past year has shown a noticeable decline in job openings, hiring, and quitting rates. They are all at or below pre-pandemic levels.
Moderation can also be seen in the different categories of job growth. Job gains have moved to less cyclically sensitive positions like education & healthcare and government (See chart below). Interestingly, construction, which tends to be cyclical with interest rates, has continued to have solid demand, but the tailwinds from the Infrastructure and CHIPS Acts are powering that.
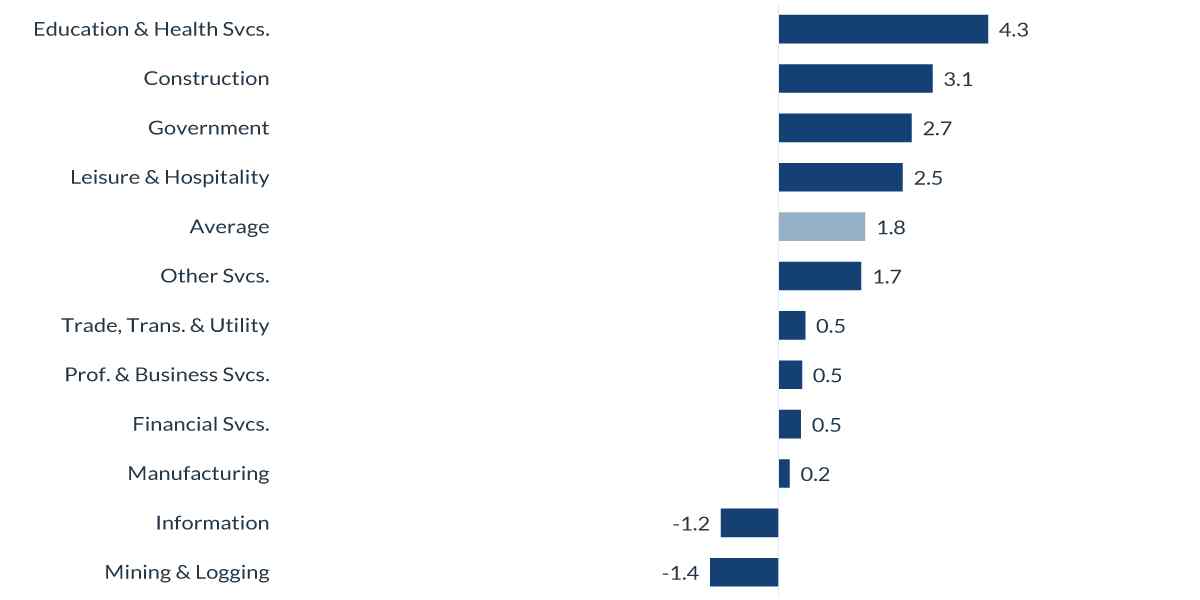
Source: Bureau of Labor Statistics, as of April 2024.
The Fed remains concerned with inflation and has kept interest rates unchanged since its last hike in July. For Fed policy, that is a long time. Combining that with the absolute change in interest rates (525 bps), one of its largest, shows that the Fed has been very hawkish.
The Fed has been forced to maintaining this hawkish monetary policy due to the stalling of disinflationary pressures. This is evident in the Consumer Price Index (CPI), which, after a significant drop of about six percentage points within a year, has been hovering around the 3.0% to 3.5% range since last summer.
Following a pickup in inflation in the first quarter, the Fed has revised its forecast, scaling back from three anticipated interest rate cuts this year to just one. This adjustment is a reflection of their cautious approach, as they await more data to gain greater confidence that inflation is on a path to a sustainable rate of 2.0%.
The recent release of May’s CPI, which had no change, is an essential step in the right direction, but it is just one data point. The Fed will need several months of continued good data before they make a move.
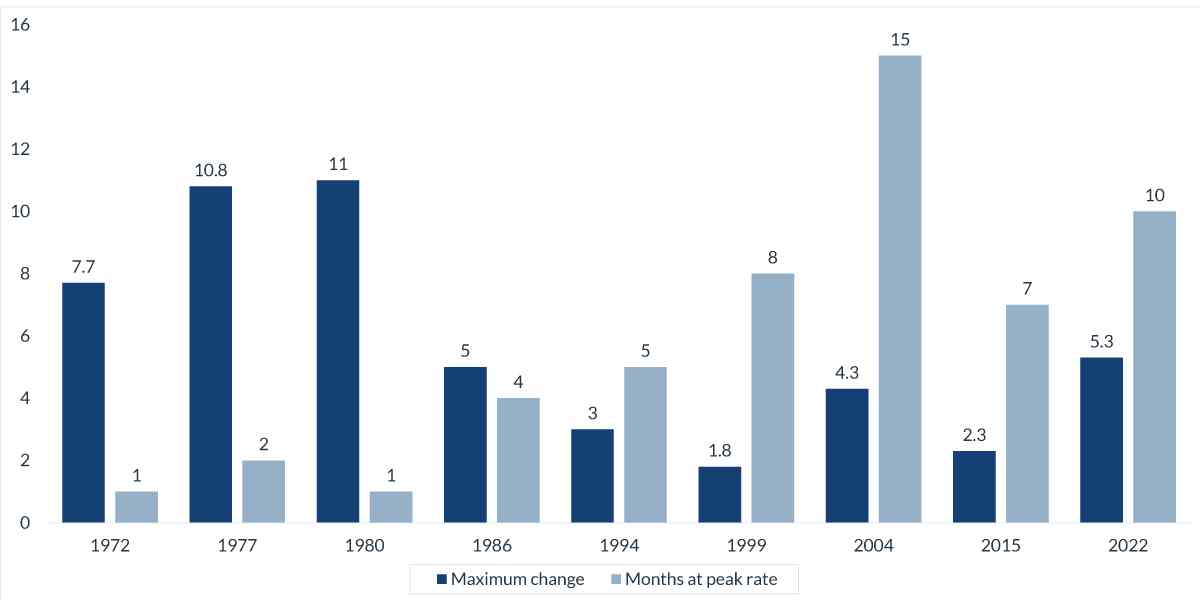
Source:Federal Reserve Bank, as of June 2024.
The stock market rally has continued its impressive run into 2024, but the largely uninterrupted pace of gains has some watchers worried about rising valuations. We don’t dismiss equity valuations entirely, but we think it’s important to put valuation measures into a wider context to make sense of them. Part of this is a weight problem. Over the past 30 years, the share of tech-related companies in the S&P 500 has increased from 8% to 42%1, skewing valuations higher. The Magnificent 7 Stocks2 alone represent about 30% of the index and has averaged forward P/E multiple of 31x1. However, looking at the P/E of the equal weight version of the S&P 500 shows a much more reasonable 16x forward P/E multiple.1
Today’s rally is also different from history. Current valuations in the technology sector are not as stretched as in previous bubble periods, and the “early winners” that have enjoyed the strongest returns have unusually strong balance sheets and returns on investment. Several other factors are also helping support elevated valuations: Inflation is now moderating, the US economic growth is holding up well, and the Fed is on the cusp of loosening monetary policy. We are also exiting an earnings recession. Results for first quarter earnings season were much stronger than expected and reinforce our belief that S&P earnings are on track to grow around 10% this year1, with growth from non-tech sectors likely accelerating in the back half of the year.
Although higher P/E ratios are generally associated with lower returns over extended periods, they are not reliable predictors of short-term returns. However, investors can leverage valuation signals to identify areas where pockets of value exist. As the possibility of Fed rate cuts looms closer, we think a broadening in market leadership beyond mega-cap technology may unfold. Historically, lower interest rates bolster better valuations and coincide with upturns in cyclical and smaller-cap segment of the market, which have so far lagged the rally.
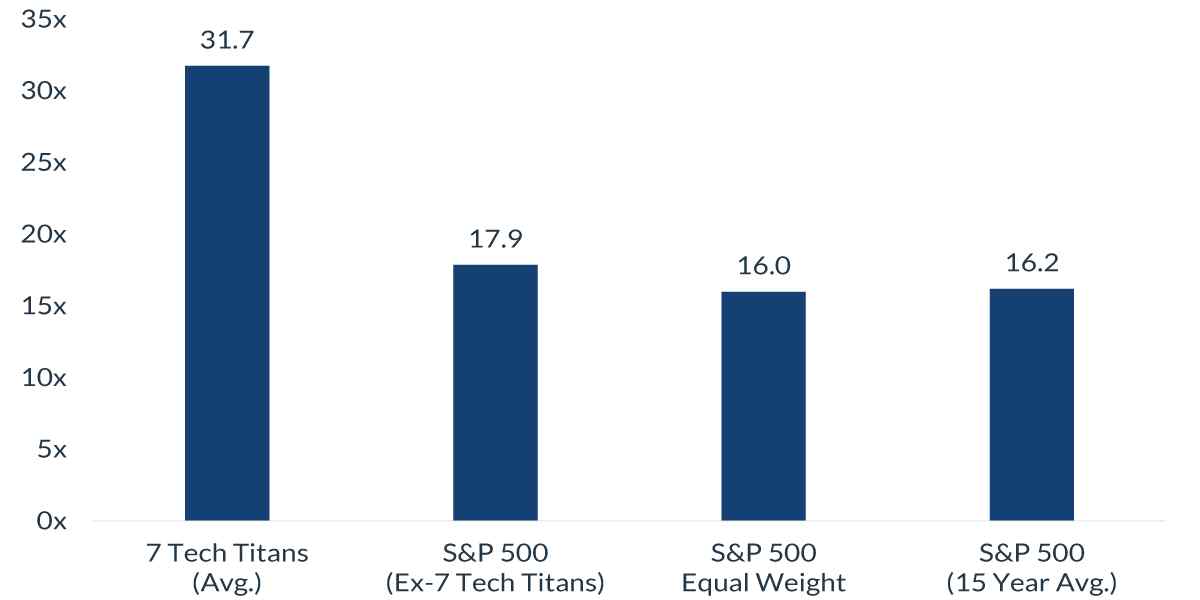
Sources: FactSet, CNR Research, as of May 31, 2024.
1 FactSet, as of June 2024
2The Magificent 7 Stocks/7 Tech Titans include Nvidia, Meta Platforms, Tesla, Amazon, Alphabet, Microsoft and Apple.
Short answer, yes. Market dislocation can create attractive entry points for long-term investors. Municipal market volatility displayed relative calm earlier in the year, but in recent weeks, price fluctuations have occurred more frequently in response to economic data and Fed policy expectations. Despite the ebb and flow of yields, the income generated by municipal bonds is currently about 50 bps higher than at the start of 2024. For example, the yield-to-worst (YTW) of the Bloomberg Municipal Bond Index, as of early June, was approximately 3.7%, or a taxable-equivalent yield3 (TEY) of 6.25%. For those investors with more risk appetite, TEY is even greater in high-yield municipal bonds. The competitive municipal TEY compares favorably to comparable US Treasury and US corporate bonds.
One of the key themes of the municipal bond market this year has been supply. The first five months of the year have generated more than $200 billion in municipal bond sales4, or about a 35% YoY increase. The strength of supply is primarily due to a few factors: pulling forward issuance ahead of the November elections, the refunding of Build America Bonds, and surges in select sectors, like higher education and healthcare. Nevertheless, with several weeks of $10B+ supply4, these technical dynamics have opened up abundant bond choices for investors. While demand has somewhat kept pace YTD, July and August represent the two largest months of bond redemptions (i.e., principal and interest payments) that we believe could lead to relative outperformance over the near term.
Municipal credit fundamentals have benefitted over the past three years from healthy budget operations and federal aid. As the economy moderates and state and local governments confront a more “normalized” revenue environment, quality and risk pricing will increasingly become important in successfully navigating the market. Current yield advantages of moving down the credit curve have diminished YTD, which underscores the need to be selective in sourcing bonds. Shifts in market technicals or sentiment should allow investors to discern issuer risk and appropriately value municipal bonds with favorable long-term credit performance potential.
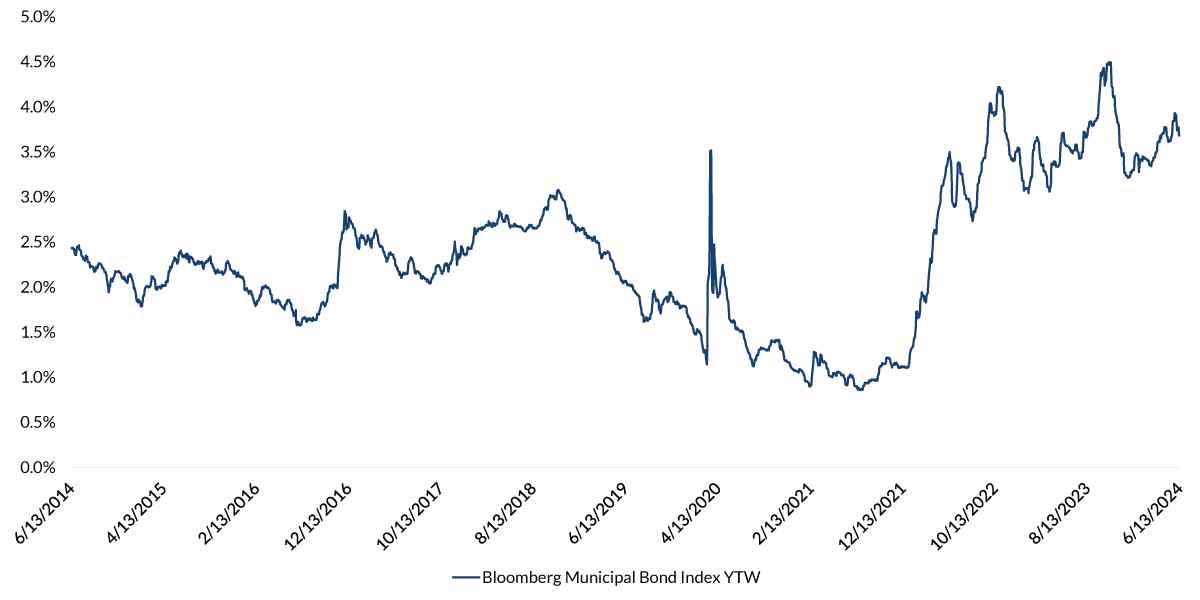
Source: Bloomberg, as of June 2024.
3Taxable Equivalent Yield is the yield required on a taxable bond to equal the yield of a comparable tax-exempt bond. The TEY calculation herein assumes 37% federal and 3.8% Medicare Surcharge.
4 Bloomberg, as of June 2024
IMPORTANT INFORMATION
The views expressed represent the opinions of City National Rochdale, LLC (CNR) whichare subject to change and are not intended as a forecast or guarantee of future results.Stated information is provided for informational purposes only, and should not beperceived as personalized investment, financial, legal or tax advice or a recommendation ofany security. It is derived from proprietary and non-proprietary sources which have notbeen independently verified for accuracy or completeness. While CNR believes theinformation to be accurate and reliable, we do not claim or have responsibility for itscompleteness, accuracy, or reliability. Statements of future expectations,estimates,projections, and other forward-looking statements are based on available information andmanagement's view as of the time of these statements. Accordingly, such statements areinherently speculative as they are based on assumptions which may involve known andunknown risks and uncertainties. Actual results, performance or events may differmaterially from those expressed or implied in such statements.
All investing is subject to risk, including the possible loss of the money you invest. As withany investment strategy, there is no guarantee that investment objectives will be met andinvestors may lose money. Diversification does not ensure a profit or protect against a lossin a declining market. Past performance is no guarantee of future performance.
Equity securities. There are inherent risks with equity investing. These risks include, but are not limited to stock market, manager or investment style. Stock markets tend to move in cycles, with periods of rising prices and periods of falling prices.
Fixed Income securities. There are inherent risks with fixed income investing. These risks include, but are not limited to, interest rate, call, credit, market, inflation, government policy, liquidity or junk bond risks. When interest rates rise, bond prices fall. This risk is heightened with investments in longer-duration fixed income securities and during periods when prevailing interest rates are low or negative.
High yield securities. Investments in below-investment-grade debt securities, which are usually called “high yield” or “junk bonds,” are typically in weaker financial health. Such securities can be harder to value and sell, and their prices can be more volatile than more highly rated securities. While these securities generally have higher rates of interest, they also involve greater risk of default than do securities of a higher-quality rating.
City National Rochdale, LLC is an SEC-registered investment adviser and wholly-owned subsidiary of City National Bank. Registration as an investment adviser does not imply any level of skill or expertise. City National Bank is a subsidiary of the Royal Bank of Canada. City National Bank provides investment management services through its subadvisory relationship with City National Rochdale. Brokerage services are provided through City National Securities, Inc., a wholly-owned subsidiary of City National Bank and Member FINRA/SIPC.
©2024 City National Rochdale
INDEX DEFINITIONS
S&P 500 Index: The S&P 500 Index, or Standard & Poor’s 500 Index, is a market-capitalization-weighted index of 500 leading publicly traded companies in the U.S. It is not an exact list of the top 500 U.S. companies by market cap because there are other criteria that the index includes.
Bloomberg Investment Grade Municipal Index: The Bloomberg Municipal Index measures the performance of the Bloomberg U.S. Municipal bond market, which covers the USD- denominated Long-Term tax-exempt bond market with four main sectors: state and local general obligation bonds, revenue bonds, insured bonds, and pre-refunded bonds.
The Bloomberg Municipal High Yield Bond Index measures the performance of non-investment grade, US dollar-denominated, and non-rated, tax-exempt bonds.
The Bloomberg U.S. Municipal Index covers the USD-denominated long-term tax exempt bond market.
MSCI EAFE Index. The MSCI EAFE (Europe, Australasia, Far East) Index is a free float-adjusted market capitalization weighted index that is designed to measure developed equity market results, excluding the US and Canada.
DEFINITIONS
CPI: A consumer price index (CPI) is a price index; i.e., the price of a weighted average market basket of consumer goods and services purchased by households. Changes in measured CPI track changes in prices over time.
Yield to worst (YTW): Yield to worst is a measure of the lowest possible yield that can be received on a bond that fully operates within the terms of its contract without defaulting.
| Non-deposit investment Products are: • not FDIC insured • not Bank guaranteed • may lose value |
If you have a client with more than $1 million in investable assets and want to find out about the benefits of our intelligently personalized portfolio management, speak with an investment consultant near you today.
If you’re a high-net-worth client who's interested in adding an experienced investment manager to your financial team, learn more about working with us here