-
Market Perspectives
Earnings Are Key To Second Half
July 2024
- Filename
- Market Perspectives JULY 2024.pdf
- Format
- application/pdf

TRANSCRIPT
PLEASE NOTE: We are all deeply saddened by the assassination attempt on former President Trump and firmly believe violence is not the answer in our current political system. Our thoughts and prayers go out to all the victims and their families. As is always the case, our focus is on assessing any potential economic and market impacts stemming from political situations and fortunately, as of this recording, markets are functioning normally, and no increased volatility is apparent.
Let’s review the first-half report card and then take a look forward. The first half of 2024 was good for most equity investors. Most major stock indices were positive. The standouts included the S&P 500, up a little more than 15%. The MSCI All Country World Index was up 11%, and the NASDAQ led the way, posting an 18.5% return.
Bringing up the rear were small cap stocks. The Russell 2000 was up, but just 1.6%, and the S&P 600, another small cap index, was down 74 basis points.
The U.S. continued to outperform international. The MSCI EAFE and Emerging Market indices were both up, 5.3% and 7.5%, respectively, both lagging the S&P 500. Most fixed-income asset classes have erased early year losses and gained positive ground in recent months.
Overall, first-half results were mixed. The Bloomberg US Aggregate Index was down 71 basis points, and the Municipal Bond Blend Index was off 63 basis points. High-yield indices fared better.
So, a rewarding first half. What can we expect for the second half? July is off to a good start. However, it is prudent to expect equity returns to moderate from the current pace.
Let’s look at valuation and breadth, two things that we’re paying attention to.
Followers of City National Rochdale Speedometers may have noted that the S&P 500 Valuation speedometer has just moved into the red. While it signals a caution, it is not a cause to sound the alarm or to adjust allocation at this point. Remember, valuation and equity outlook are separate things.
S&P 500 Earnings Growth Forecasts
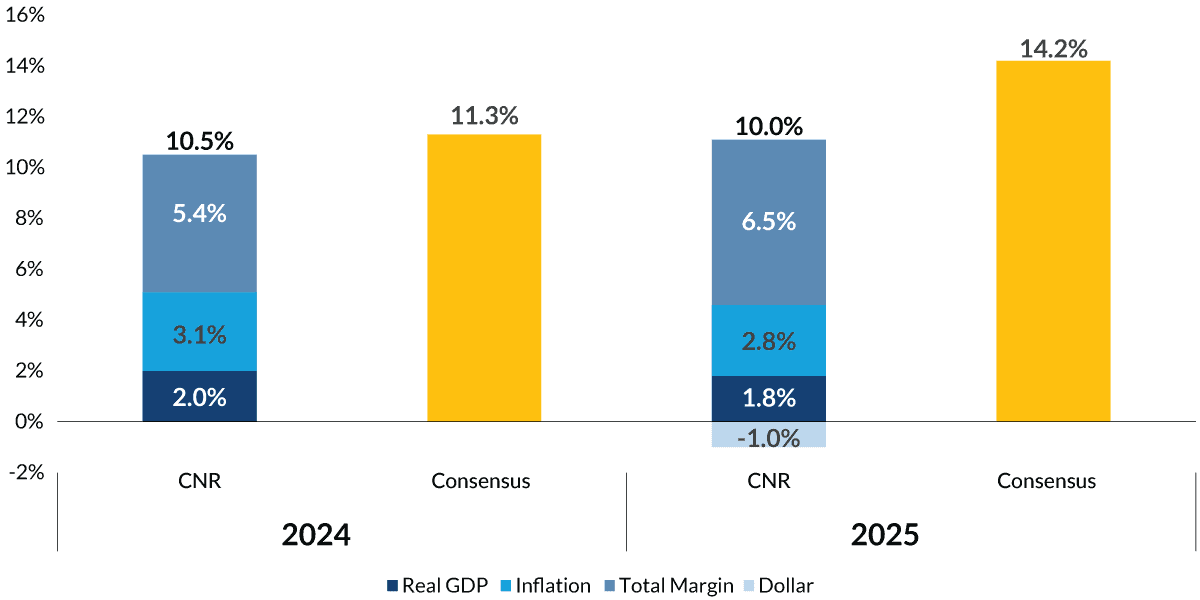
Sources: FactSet, as of June 2024.
Information is subject to change and is not a guarantee of future results.
Chart 1, 2:04— You will recall that corporate earnings have been exceeding expectations, which eases the valuation pressures. As seen here, City National Rochdale’s earnings growth expectations are lower than consensus but still healthy continuing into 2025. If earnings forecast proves correct, the weight of higher valuations eases. Note, second-quarter earnings season is kicking off.
Price-to-Earnings Ratio and 12-Month Returns
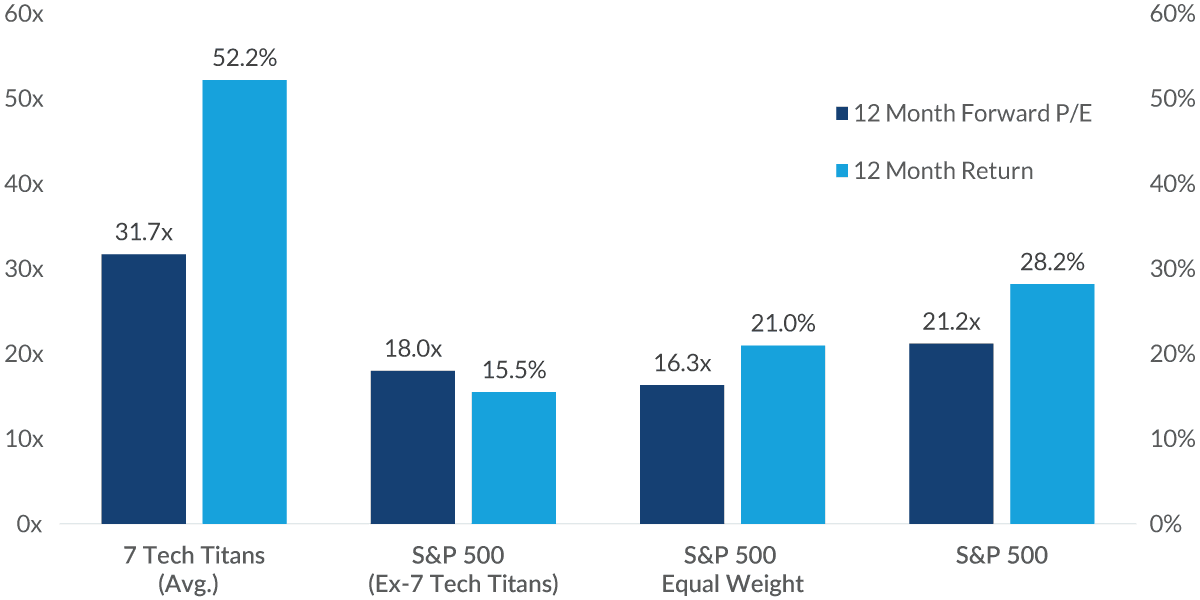
Source: Factset, as of June 2024.
Past performance is no guarantee of future results.
Magnificent 7 Stocks/7 Tech Titans include Nvidia, Meta Platforms, Tesla, Amazon, Alphabet, Microsoft and Apple.
Chart 2, 2:30— We believe that broad valuations don’t tell the full story, and many companies are trading at lower valuations. Valuation is not a good predictor of short-term returns. It’s more broadly correlated with long-term returns. It’s one component. Current trends and momentum matter as well.
As you can see on this chart, dissecting valuations provides different perspectives to the overall headline number.
YTD S&P 500 Return vs Sector Weight
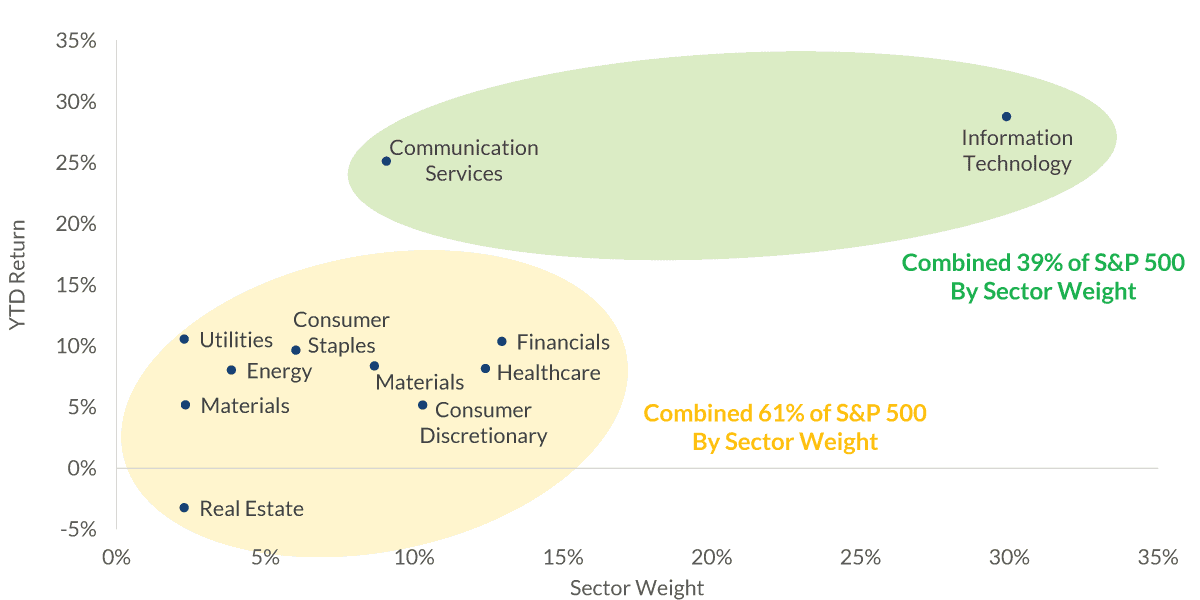
Source: Factset, as of June 2024.
Past performance is no guarantee of future results.
Chart 3, 2:57— I want to address questions and comments that have arisen from those who have heard us state that the market rally is broader this year than last year’s narrow magnificent seven–led rally. Allow me to clarify.
Yes. Breadth is better. However, yes, the rally is still lopsided.
Communication services and tech are still leading the way, but all of the other sectors are positive year to date. except one. Real estate is the loan sector viewing the party from the outside.
So better, yes, but we’d still like to see more breadth.
To sum up, keeping an eye on earnings, the consensus second quarter S&P 500 year-over-year earnings estimate remains over 8%, which is the highest growth rate since the first quarter of 2022. Hopes for the rally to broaden will be tested by reported profit growth in the sectors outside of the tech-related leaders.
Important Information
The views expressed represent the opinions of City National Rochdale, LLC (CNR) which are subject to change and are not intended as a forecast or guarantee of future results. Stated information is provided for informational purposes only, and should not be perceived as personalized investment, financial, legal or tax advice or a recommendation for any security. It is derived from proprietary and non-proprietary sources which have not been independently verified for accuracy or completeness.
While CNR believes the information to be accurate and reliable, we do not claim or have responsibility for its completeness, accuracy, or reliability. Statements of future expectations, estimates, projections, and other forward-looking statements are based on available information and management's view as of the time of these statements. Accordingly, such statements are inherently speculative as they are based on assumptions which may involve known and unknown risks and uncertainties. Actual results, performance or events may differ materially from those expressed or implied in such statements.
Past performance or performance based upon assumptions is no guarantee of future results.
All investing is subject to risk, including the possible loss of the money you invest. As with any investment strategy, there is no guarantee that investment objectives will be met and investors may lose money. Diversification does not ensure a profit or protect against a loss in a declining market.
Equity investing strategies & products. There are inherent risks with equity investing. These risks include, but are not limited to stock market, manager or investment style. Stock markets tend to move in cycles, with periods of rising prices and periods of falling prices.
Fixed Income investing strategies & products. There are inherent risks with fixed income investing. These risks include, but are not limited to, interest rate, call, credit, market, inflation, government policy, liquidity or junk bond risks. When interest rates rise, bond prices fall. This risk is heightened with investments in longer-duration fixed income securities and during periods when prevailing interest rates are low or negative.
Municipal securities. The yields and market values of municipal securities may be more affected by changes in tax rates and policies than similar income-bearing taxable securities. Certain investors' incomes may be subject to the Federal Alternative Minimum Tax (AMT), and taxable gains are also possible. Investments in the municipal securities of a particular state or territory may be subject to the risk that changes in the economic conditions of that state or territory will negatively impact performance. These events may include severe financial difficulties and continued budget deficits, economic or political policy changes, tax base erosion, state constitutional limits on tax increases and changes in the credit ratings.
City National Rochdale, LLC is an SEC-registered investment adviser and wholly-owned subsidiary of City National Bank. Registration as an investment adviser does not imply any level of skill or expertise. City National Bank is a subsidiary of the Royal Bank of Canada. City National Bank provides investment management services through its subadvisory relationship with City National Rochdale. Brokerage services are provided through City National Securities, Inc., a wholly-owned subsidiary of City National Bank and Member FINRA/SIPC.
© 2024 City National Rochdale, LLC. All rights reserved.
Index Definitions
The Standard & Poor’s 500 Index is a market capitalization-weighted index of 500 common stocks chosen for market size, liquidity, and industry group representation to represent US equity performance.
The Magnificent 7: The seven companies commonly recognized for their market dominance, their technological impact, and their changes to consumer behavior and economic trends: Alphabet (GOOGL; GOOG), Amazon (AMZN), Apple (AAPL), Meta Platforms (META), Microsoft (MSFT), NVIDIA (NVDA), and Tesla (TSLA).
MSCI All Country World Index (ACWI):The MSCI All Country World Index (ACWI) is a stock index designed to track broad global equity-market performance.
The NASDAQ 100 Index is a collection of the 100 largest, most actively traded companies listed on the Nasdaq stock exchange.
iShares is a collection of exchange-traded funds (ETFs) that offer exposure to a variety of market segments, including broad-based indexes. iShares ETFs are managed by BlackRock, the world's largest asset management company, and cover a wide range of U.S. and international sectors and indexes.
Russell 2000 Index. The Russell 2000® Index is a market capitalization-weighted index measuring the performance of the small-cap segment of the US equity universe and includes the smallest 2,000 companies in the Russell 3000® Index.
MSCI EAFE Index. The MSCI EAFE (Europe, Australasia, Far East) Index is a free float-adjusted market capitalization weighted index that is designed to measure developed equity market results, excluding the US and Canada.
Bloomberg Barclays US Aggregate Bond Index (LBUSTRUU): The Bloomberg Aggregate Bond Index or “the Agg” is a broad-based fixed-income index used by bond traders and the managers of mutual funds and exchange-traded funds (ETFs) as a benchmark to measure their relative performance.
Bloomberg Municipal Bond Index: The Bloomberg US Municipal Bond Index measures the performance of investment grade, US dollar-denominated, long-term tax-exempt bonds.
The Barclays Capital Municipal Bond 1-10 Year Blend Index measures the performance of municipal bonds with maturities between one and 10 years.
CNR Speedometers® are indicators that reflect forecasts of a 6 to 9 month time horizon. The colors of each indicator, as well as the direction of the arrows represent our positive/negative/neutral view for each indicator. Thus, arrows directed towards the (+) sign represents a positive view which in turn makes it green. Arrows directed towards the (-) sign represents a negative view which in turn makes it red. Arrows that land in the middle of the indicator, in line with the (0), represents a neutral view which in turn makes it yellow. All of these indicators combined affect City National Rochdale’s overall outlook of the economy.
Stay Informed.
Get our Insights delivered straight to your inbox.

Put our insights to work for you.
If you have a client with more than $1 million in investable assets and want to find out about the benefits of our intelligently personalized portfolio management, speak with an investment consultant near you today.
If you’re a high-net-worth client who's interested in adding an experienced investment manager to your financial team, learn more about working with us here.