-
Fixed Income Perspectives
Higher for Longer Remains Intact –What this Means for Fixed Income
April 2024
- Filename
- Fixed Income Perspectives APRIL 2024.pdf
- Format
- application/pdf
Series Overview
Watch this new monthly video series featuring CNR's own Deputy CIO, Charles Luke, as he discusses trends within the macroeconomic landscape affecting Fixed Income markets and interest rates.
After 20+ years of zero interest rate policy, an entirely new set of opportunities is available to investors with higher yields and more dispersion, which have the potential to positively impact returns. Charles will help dismantle the complexity of bonds by exploring the differences between asset types and distilling the labyrinth of economic factors into what matters most for investors.
TRANSCRIPT
I'd like to start this new series with a question that nearly all investors have been asking, and that is — has the attractiveness of the bond market improved, and what is the right level of interest rates?
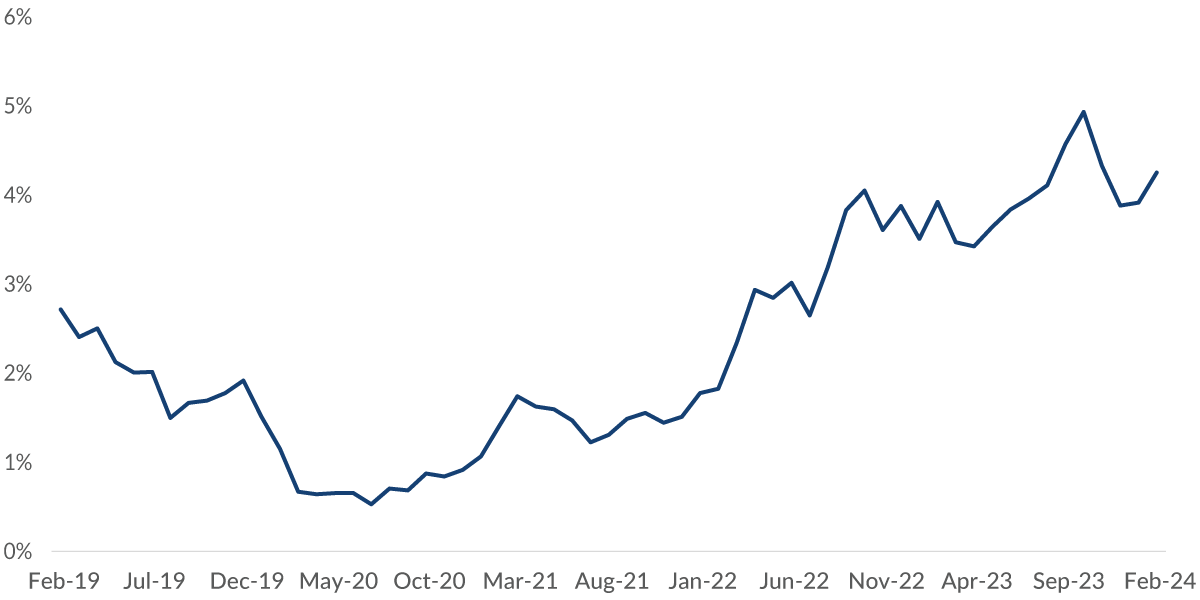
10 Year U.S. Treasury Yield (%)

Data current as of March 26, 2024
Source: Bloomberg
Information is subject to change and is not a guarantee of future results.
Chart 1: 0:33– If we back up to 50,000 feet, yields have not been this high since August of 2009, and history is easily forgotten. But at the end of 2020, corporate bond yields reached an all-time low of 1.7%. Today's current level, around 5.5% for a corporate bond, is more than a 300% increase in yield, and, as you can see from the current chart, the 10-year treasury got extremely low after the pandemic and has climbed significantly.
Aside from yield, the quality of the bond markets is on solid footing. Borrower fundamentals are strong, profitability is improving, economic activity is above trend, and yields more than offset the current levels of inflation, and we believe that the yields and the underlying strength in the bond market will have two key outcomes on portfolios: First, our return assumptions have increased across all sectors of the bond market, which means they will be higher than what investors grew accustomed to over the past 15 years, and second, we expect higher yields to dampen volatility.
After years of disappointing investors, there's evidence to suggest that bonds are much better positioned now to minimize volatility with the potential to stabilize portfolio values, but questions do remain with respect to which bonds to buy, and the potential for interest rate cuts has certainly fueled debate on whether to continue to take advantage of cash and short-term maturities or to shift the portfolio into longer-term bonds to lock in the current level of interest rates.
So, all roads lead back to understanding where exactly the 10-year treasury yield should be, and our view for some time has been a higher-for-longer environment for interest rates. While this view has been challenged over the past 18 months, we firmly believe that rates above 4% are here to stay over 2024 and are likely to drift between the range of about 4-4.5%, and let's discuss the three core reasons why:
Surprise
(Moving Average)

Data current as of March 26, 2024
Source: Bloomberg
Information is subject to change and is not a guarantee of future results.
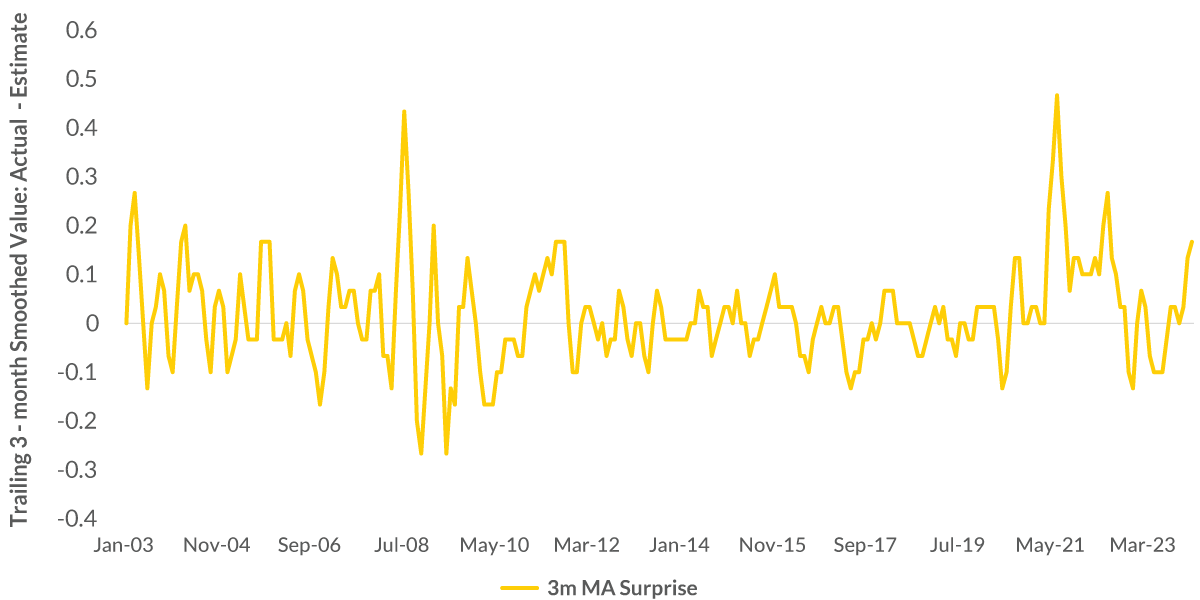
Chart 2: 2:29– So, price pressures are still in the system. As you'll see from this chart, which refers to CPI surprising above expectations, both the consumer price inflation, or CPI (and that's what you and I pay for goods and services we use), and the producer price inflation, or PPI (that's the price companies pay to provide goods and services to us), both measures came in above expectation and well above the run rates that we saw last year in December. This signals to us an upside risk to inflation, and that will keep yields elevated. We're also observing price pressures from a tight job market, and that's still pushing wages higher than trend. Wages are key to downstream inflation due to the health of consumers. If wages continue growing at these rates, it's hard to see inflation declining rapidly.
The second component is that the market has unwound expectations for Federal Reserve interest rate cuts in 2024. At one point, the market for Fed funds was pricing in seven interest rate cuts. But based on the data in the first quarter, these aggressive expectations have shifted to align with the Fed's forecast of just two to three cuts this year, and we agree. Fewer cuts imply the economy remains on solid footing and rates should stay high.
And last, the probability of a recession in 2024 has decreased, and that signals that a soft landing is possible. If this occurs and growth stays positive, it will continue to lower the appetite for conservative portfolio positioning. And practically, this means that flows into riskier assets such as stocks and high yield bonds are likely to continue, and we think that will set a floor on yields around 4%.
MOVE Index
VIX Index

Data current as of March 26, 2024
Sources: Bloomberg
Information is subject to change and is not a guarantee of future results.
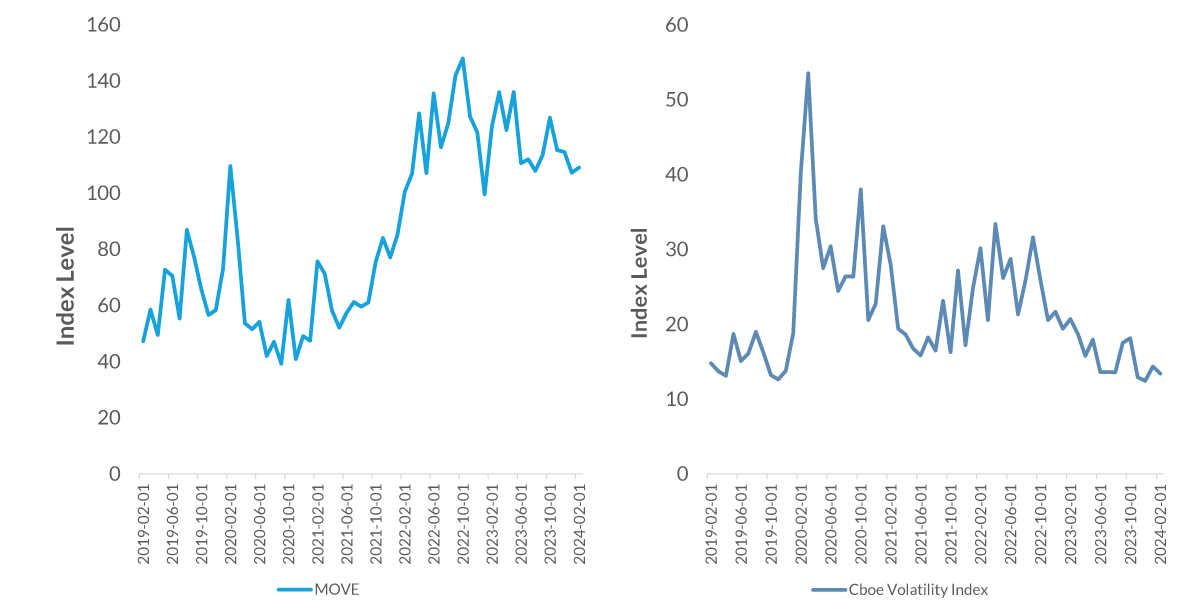
Charts 3 & 4: 4:03– Now, there are also signs that the volatility investors have experienced across markets over the past two years is starting to decline. On the current chart, you can see the VIX index for equities and the MOVE index for treasuries, which both are measures of volatility, and they both declined this year from elevated levels over 2022 and 2023. Calmer markets will bring more stability to interest rates.
And this brings us back to our core outlook. What are our recommendations? What should you be buying? And we prefer to take risk in corporate bonds as opposed to U.S. Treasury securities.
Given the higher for longer environment and the strong fundamentals, this gives investors the potential to maximize income and to leverage the defensive characteristics of corporate credit based on higher yields. For investors in high-tax states like California and New York, the municipal bond market is currently offering exceptional value. And where possible, we're also positioning portfolios with an average maturity of five years. You may have heard this referred to as intermediate maturities.
This will help investors to keep portfolio yields high over the longer term and avoid lower cash returns if the Fed does cut interest rates.
History shows us that buying long-term maturities before short-term rates start to fall is a better approach than holding on to cash. And while we certainly acknowledge that risks do remain, the future is the brightest it's been for fixed income returns in a very long time.
Important Information
The views expressed represent the opinions of City National Rochdale, LLC (CNR) which are subject to change and are not intended as a forecast or guarantee of future results. Stated information is provided for informational purposes only, and should not be perceived as personalized investment, financial, legal or tax advice or a recommendation for any security. It is derived from proprietary and non-proprietary sources which have not been independently verified for accuracy or completeness. While CNR believes the information to be accurate and reliable, we do not claim or have responsibility for its completeness, accuracy, or reliability. Actual results, performance or events may differ materially from those expressed or implied in such statements. All investing is subject to risk, including the possible loss of the money you invest. As with any investment strategy, there is no guarantee that investment objectives will be met, and investors may lose money. Diversification does not ensure a profit or protect against a loss in a declining market. Past performance is no guarantee of future performance.
City National Rochdale, LLC, is a SEC-registered investment adviser and wholly owned subsidiary of City National Bank. Registration as an investment adviser does not imply any level of skill or expertise. City National Bank and City National Rochdale are subsidiaries of Royal Bank of Canada.
Index Definitions
MOVE Index: The MOVE Index measures U.S. bond market volatility by tracking a basket of OTC options on U.S. interest rate swaps. The Index tracks implied normal yield volatility of a yield curve weighted basket of at-the-money one-month options on the 2-year, 5-year, 10-year, and 30-year constant maturity interest rate swaps.
VIX Index: The VIX Index is a financial benchmark designed to be an up-to-the-minute market estimate of the expected volatility of the S&P 500® Index and is calculated by using the midpoint of real-time S&P 500 Index (SPX) option bid/ask quotes.
Stay Informed.
Get our Insights delivered straight to your inbox.
Check out previous perspectives:
Put our insights to work for you.
If you have a client with more than $1 million in investable assets and want to find out about the benefits of our intelligently personalized portfolio management, speak with an investment consultant near you today.
If you’re a high-net-worth client who's interested in adding an experienced investment manager to your financial team, learn more about working with us here.


